


SSD market chart
Track how SSD prices move across 1TB, 2TB, 4TB and 8TB capacities, compare price per terabyte, and judge current offers against the market instead of a discount badge alone.
SSD price crisis explained
Why SSD prices can change so quickly
For buyers, the SSD price crisis is not only about whether drives are expensive. The harder problem is volatility. SSD prices can fall quickly when NAND supply is plentiful or retailers are clearing inventory, then turn upward when supply tightens, production is adjusted, popular capacities sell through, or a new product generation changes the mix on store shelves. That is why a price that looked ordinary a few weeks ago can suddenly look attractive, while a large discount badge can still leave a drive above its recent market range.
Capacity also matters. The 1TB market can move differently from 2TB, 4TB or 8TB because each capacity has a different buyer mix and different levels of competition. A 4TB SSD may have a higher total checkout price but a lower price per terabyte than a 1TB model. Likewise, PCIe 5.0 drives can remain expensive while mature PCIe 4.0 models become much more competitive. Looking only at the headline price hides those differences.
This chart is designed to make that volatility visible. Instead of asking whether an SSD is simply "cheap" or "expensive," compare the current median price per TB with the recent range, then narrow the chart to the capacity and SSD class you actually need. The lowest observed line shows what aggressive pricing has looked like, while the median helps show where the broader market is trading.
The practical goal is not to identify a perfect market bottom. It is to recognize a good buying window. If the exact type and capacity you need are already in the lower part of the recent range, the difference between buying today and waiting for an uncertain future low may be small. If the current market is well above its recent range and you have no urgent need, waiting and watching becomes more reasonable.
Quick answer
The current tracked median is $208.92/TB for all ssds.
The lowest observed current benchmark is $68.89/TB. Use the chart to see whether today’s market is above or below recent levels, then compare current offers below.
Price per TB
SSD price chart over time
Current value by capacity
Current SSD options
Current SSD prices to compare
Compare these SSDs with the market range above before buying. A strong deal should combine a competitive price per TB with the right capacity, interface, form factor, endurance and warranty for your system.

MINISFORUM N5 Air 5-Bay Desktop NAS with up to 174 GB Storage, AMD Ryzen 7 255 (8C/16T) CPU, Dual DDR5 RAM Slots (up to 96 GB), 1x 10GbE, 1x 5GbE, 2X USB4 (8K), HDMI 8K, OCuLink, 3X M.2 Slots

TEAMGROUP T-Force Vulcan Z 1TB SLC Cache 3D NAND QLC 2.5 Inch SATA III Internal Solid State Drive SSD (R/W Speed up to 550/470 MB/s) T253TY001T0C101
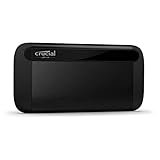
Crucial X8 4TB Portable SSD - Up to 1050MB/s - PC and Mac - USB 3.2 External Solid State Drive - CT4000X8SSD9

TEAMGROUP T-Force Vulcan Z 1TB SLC Cache 3D NAND TLC 2.5 Inch SATA III Internal Solid State Drive SSD, PC Upgrade (Read/Write Speed up to 550/500 MB/s) T253TZ001T0C101

Crucial MX500 2TB 3D NAND SATA 2.5 Inch Internal SSD, up to 560MB/s - CT2000MX500SSD1

Western Digital 4TB WD Blue SA510 Internal Solid State Drive SSD - SATA III 6 Gb/s, 2.5"/7mm, Up to 560 MB/s - WDS400T3B0A
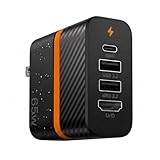
1TB SSD Storage Hub, 65W USB-C Hub with HDMI, USB 3.2 & PD

Western Digital 2TB WD Blue SA510 SATA Internal Solid State Drive SSD - SATA III 6 Gb/s, 2.5"/7mm, Up to 560 MB/s - WDS200T3B0A

Sandisk 8TB Desk Drive SSD, Up to 1000MB/s Read Speeds, Black

Kingston NV3 1TB M.2 2230 NVMe SSD | Up to 6000MB/s | SNV3SM3/1T0

Kingston NV3 2TB M.2 2280 NVMe SSD | PCIe 4.0 Gen 4x4 | Up to 6000 MB/s | SNV3S/2000G

TEAMGROUP T-Force Vulcan Z 4TB SLC Cache 3D NAND QLC 2.5 Inch SATA III Internal Solid State Drive SSD (R/W Speed up to 550/470 MB/s) T253TY004T0C101

SP Silicon Power 4TB SSD 3D NAND A55 SLC Cache Performance Boost SATA III 2.5'' 7mm (0.28'') Internal Solid State Drive (SP004TBSS3A55S25)

Crucial BX500 2TB 3D NAND SATA 2.5-Inch Internal SSD, up to 540MB/s - CT2000BX500SSD1, Solid State Drive

GiGimundo 2TB Magnetic Portable SSD, External SSD Up to 2000MB/s with USB-C 3.2 Gen 2x2, 4K ProRes HDR Record and Store, External Solid State Drives Compatible with iPhone 17/16/15 Pro Max, Tablet

GiGimundo 2TB Magnetic Portable SSD, Up to 2000MB/s, External Solid State Drives with USB-C 3.2 Gen 2x2 Compatible with iPhone 15/16/17 Series and Other USB-C Devices– Fast File Transfer

nusyn NSU53 1TB External SSD/USB Drive - Up to 1050MB/s, 2-in-1 USB-C + USB-A, USB 3.2 Gen2, Portable Solid State Drive for iPhone, Android Phones/Tablets, PS4, Windows & Mac

Fikwot FP107 4TB Magnetic Portable SSD, 2050MB/s USB 3.2 Gen 2x2 Portable SSD with RGB Lighting, 4K Video Storage, External Solid State Drives for iPhone15/16, Android/PC/Mac, PS5/PS4(Pro) etc.
Buying timing
When is the best time to buy an SSD?
The best time is usually not a specific calendar date. It is when the SSD class and capacity you need are trading near the lower part of their recent range and the exact product meets your requirements.
Buy when the chart is near the recent low
If the current median and the offer you are considering are close to the lower part of the tracked range, you already have evidence that pricing is competitive. Waiting for the absolute bottom can save little while adding uncertainty.
Wait when the market is clearly elevated
If the selected capacity is well above its recent range, your current drive still has enough space, and there is no deadline, keep watching. A higher-than-normal market gives you less reason to rush.
Buy the right SSD, not only the cheapest SSD
A low price per TB is valuable only if the drive fits the system and workload. Check interface, form factor, endurance, warranty, heatsink needs and sustained performance before treating the cheapest listing as the best purchase.
How to use an SSD price chart
Compare price per TB, not just sticker price
A 4TB SSD can cost more in total while still offering better value per terabyte than a 1TB drive. Use the capacity comparison before calling one listing expensive.
Look at the recent range
A current offer near the lower end of the recent market range is more meaningful than a discount badge with no price history behind it.
Keep interfaces separate
PCIe 5.0, PCIe 4.0, SATA and portable SSDs serve different buyers. Filter to the product class you actually need before comparing market prices.
How Cloudzat measures SSD prices
Same metric across the market
Cloudzat compares price per terabyte so 500GB, 1TB, 2TB, 4TB and 8TB drives can be judged on a consistent basis while still showing the total price of each current offer.
Dated observations, not reconstructed history
The history comes from prices Cloudzat actually captured on each tracked date. If a selected segment does not have enough history, the page says so rather than filling the gap with estimates.
Confirm the final price before checkout
SSD prices can change quickly. If a card is marked as a last-verified price, use it as a comparison point and confirm the current Amazon price and availability before buying.
SSD Price Chart FAQ
What does the SSD price chart measure?
It tracks the median and lowest SSD price per terabyte Cloudzat observed for the selected SSD class, capacity and condition.
Why use price per TB?
Price per TB makes different capacities easier to compare. Total drive price still matters, especially when you have a fixed budget or only need a small amount of storage.
How should I use the Amazon prices shown here?
Use them as current shopping comparisons alongside the market data. If a card is marked as a last-verified price, confirm the current Amazon price and availability before checkout.