What is GTmetrix?
GTmetrix is a website performance testing tool that helps in finding out what is wrong with the website and allows drilling down on the elements that lead to slow page load time. It uses grading system and scores to tell how well a website is performing. GTmetrix combines both YSlow and Google PageSpeed Insights to let you know every detail you need to fix your website’s performance.
It is needless to say that at times, GTmetrix can be downright confusing, because most of the analysis gives a detailed view of complex things that only a learned person can decipher. By learned person I am referring to developers who can understand all those coding stuff that most of the general end-users cannot understand.
However, with little effort and time investment, you can figure out quite a few things that can help you optimize your site without the need for hiring a developer.
Introduction to GTmetrix
GTmetrix is a website performance testing tool which helps you to understand how fast your website is loading. It will tell you what’s wrong and what can be done to fix the errors. You can similar tools available that you can use for testing your website speed. For instance, you can use Pingdom, which is by far, one of the most popular tools available. There’s another one – Google PageSpeed Insights that uses Lighthouse to test your website.
Now, GTmetrix actually integrates Lighthouse because it is provided by Google, and it is needless to say that Google always has the final say. Pingdom, on the other hand, doesn’t integrate Lighthouse, and hence, it is not a good choice. Moreover, Pingdom doesn’t recognize Brotli compression (an alternative to Gzip compression) introduced by Cloudflare.
So, with these problems in mind, my recommendation is to use Google PageSpeed Insights. The problem with PageSpeed Insights is that it doesn’t give enough insights on the errors. Whatever it provides is not really comprehensive enough for average Joes. Only developers can understand it properly.
GTmetrix on the other hand gives better insights that you can work with even if you are not a developer. Still, it does take some technical expertise to understand and implement the resolutions.
In this GTmetrix review, I will walk you through the tool and provide you with an explanation of how to understand the commonest information that the tool offers after analyzing a webpage.
Ready?
Analysis Options Available with GTmetrix
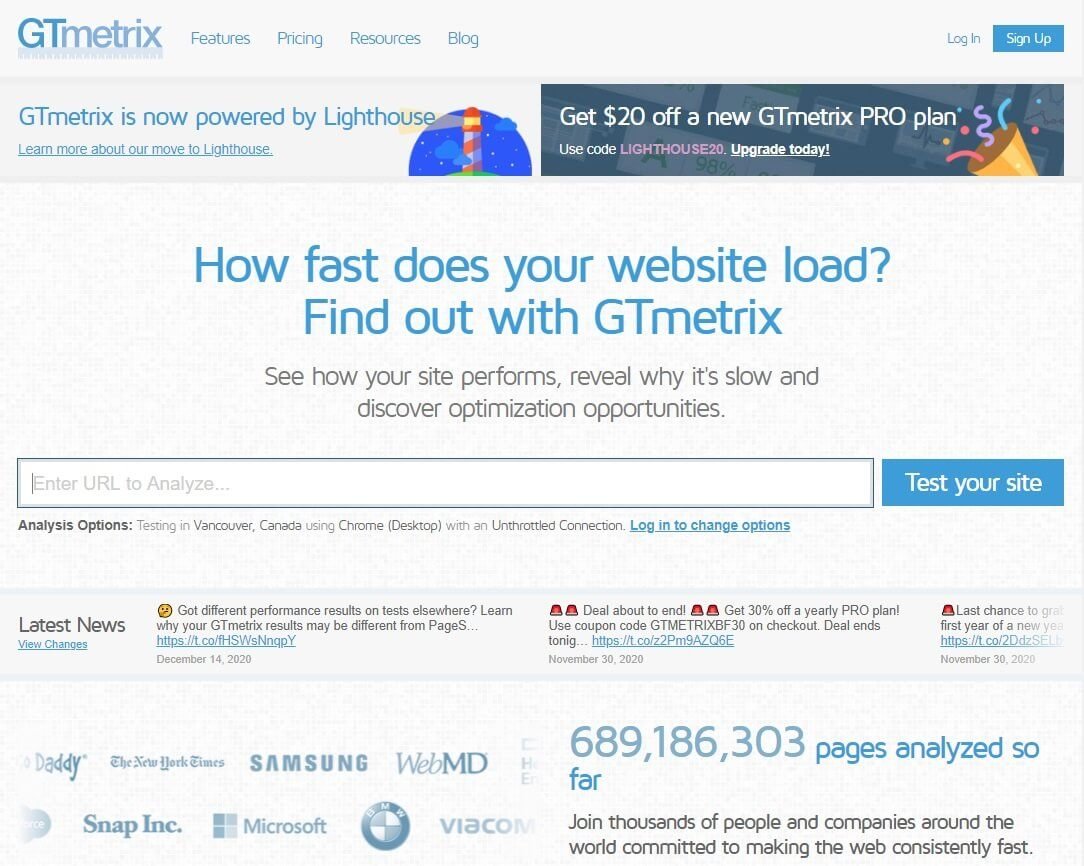
GTmetrix has a basic version and a pro version. The basic version is free. You can use it with or without signing into GTmetrix. However, if you do sign in, you will get some extras even with the free version.
The pro or the premium version gives access to a lot more tools. If you are interested in them, you can go ahead and purchase the premium version. However, for the purpose of this review, I will be using the free version. The free variant is powerful enough to give you actionable insights.
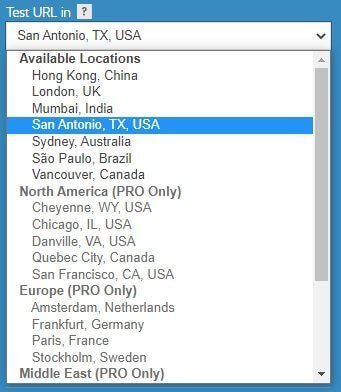
If you create an account with GTmetrix and sign in (something I highly recommend), you will get the ability to select the test server location. Choosing a location will impact your test results. That happens because the further the test location from your actual website location, the higher the latency and hence, slower the speed.
The free version will allow you to select from the following locations:
- Hong Kong, China
- London, UK
- Mumbai, India
- San Antonio, TX, USA
- Sydney, Australia
- São Paulo, Brazil
- Vancouver, Canada
The rest of the locations are available only and only to pro users:
Also, once you sign in, you will also get the option of selecting the browser and the platform (Windows, Android, phone, tablet, etc.). You can also select the connection speed, turn on privacy, create a video, etc. If you don’t sign in, you will not get access to these features. However, don’t forget that some elements in these features are restricted for free users, and accessible only to registered users of their pro or premium version.
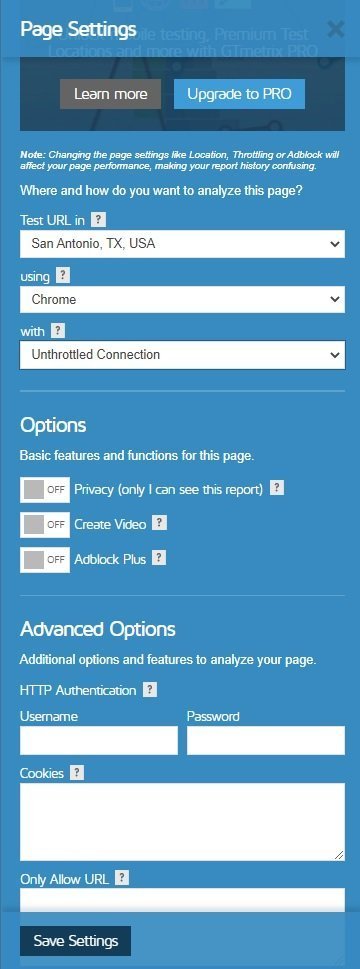
The Adblock Plus option will allow you to test the speed of your website by blocking ads on your site (if you are running third-party ads like AdSense or similar ad networks, they can impact the overall speed of your website).
However, for majority of the blogs out there, ad networks are the primary income source. So, turning off ad might not be a great choice. The way out is to the optimize the site for the remaining things and ensure that you are using an ad network that uses lazy loading of ads (for instance, Mediavine).
So, how do you carry out GTmetrix tests? Let’s find out…
GTmetrix Speed Test Tool – How to Analyze
Any webpage will have different assets that include images, videos (possibly), CSS files, JavaScript files, HTML, etc. When you try to view a webpage, all of these assets generate requests for rendering the webpage on the browser.
If the number of requests is too high, the webpage loads slowly. There is an inverse relationship. If the requests are low in count, the webpage will render quickly.
In this review, not only will I be using the free version, but also, login to GTmetrix and run two tests – one without Adblock Plus and one with Adblock Plus. Both will give you a fair idea of how ads can impact the speed of your site.
For your information, this is the overall setup will be using:
- A production site that has been into existence since 2014.
- WordPress [Latest Version].
- Server: DigitalOcean Cloud VPS.
- Web Server: OpenLiteSpeed.
- CDN: Cloudflare Premium (and free QUIC.cloud).
- Cache Plugin: LiteSpeed Cache.
- Plugins: Total 8 plugins including the cache plugin.
- Ad Network: Mediavine.
- Sharing Options: Grow.me (by Mediavine).
- Images: Yes (WebP version for supported browsers).
- Mail: Works via Google Workspace.
- PHP version: 7.4
- Theme: GeneratePress Premium
That’s the overall setup I have. To test the website speed, I used the following default configuration with GTmetrix:
- Desktop with Chrome.
- Unthrottled Connection (Internet Connection).
- Test Location: San Antonio, TX, USA.
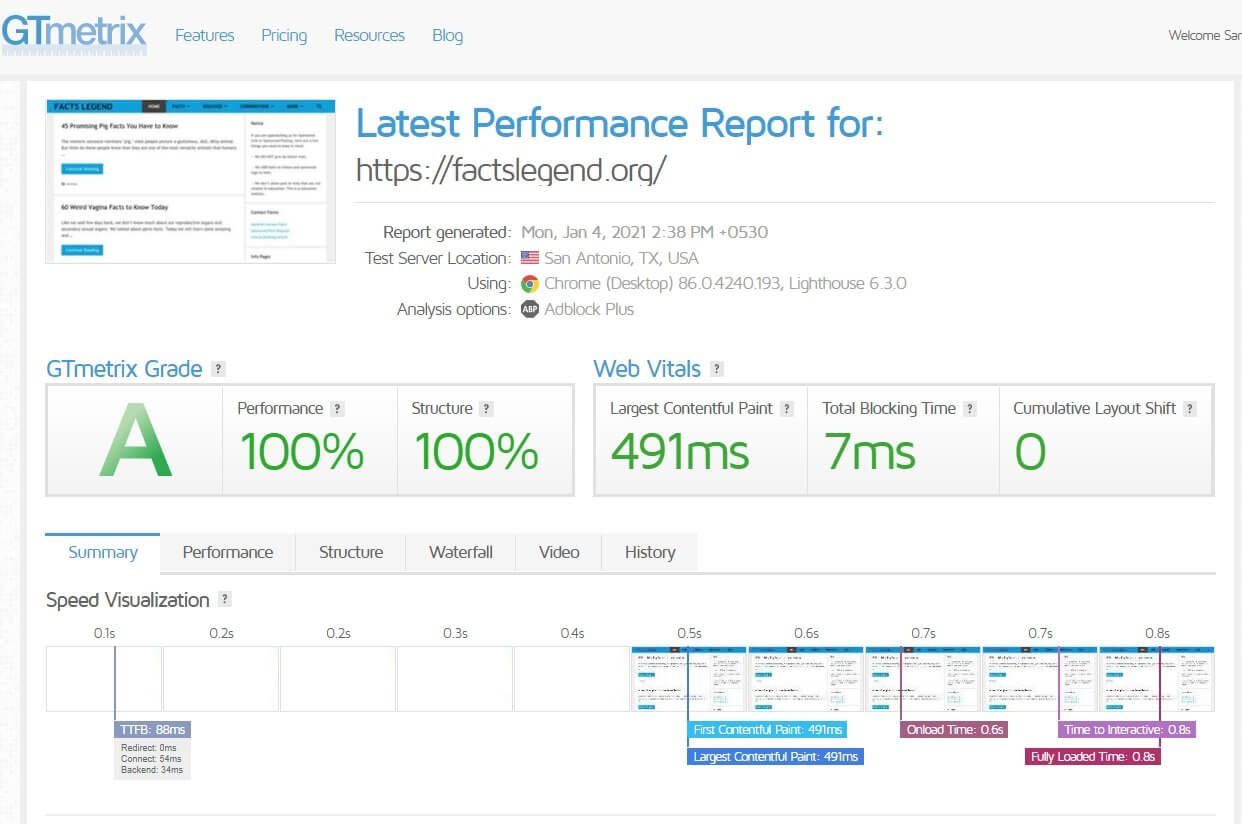
Test Result with Adblock Plus Turned ON
Test Result with Adblock Plus Turned OFF
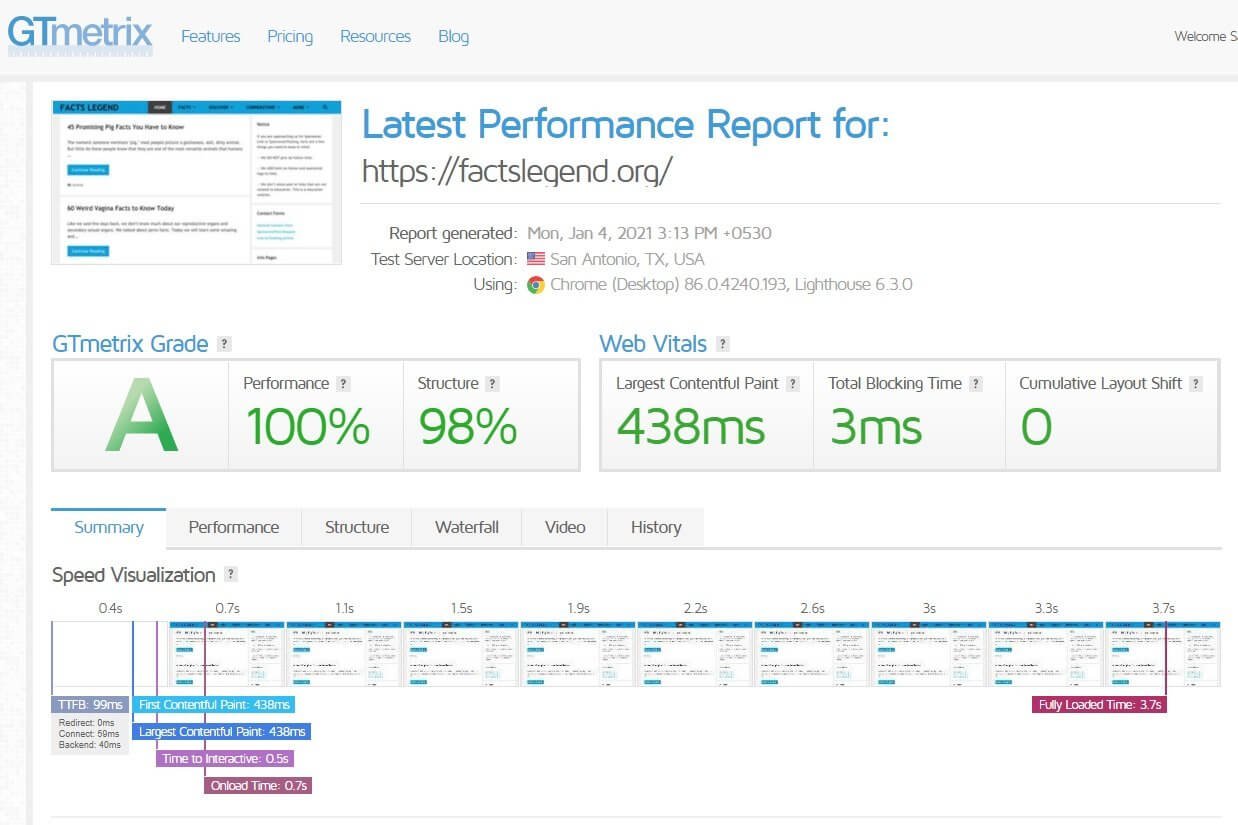
In both the screenshots you will find the following elements:
- Performance [GTmetrix Grade]
- Structure [GTmetrix Grade]
- Largest Contentful Paint [Web Vitals]
- Total Blocking Time [Web Vitals]
- Cumulative Layout Shift [Web Vitals]
- Summary [Tab]
- Performance [Tab]
- Structure [Tab]
- Waterfall [Tab]
- Video [Tab]
- History [Tab]
What are these things? What do they signify? What information do you get from them? I will answer your websites now.
GTmetrix Grade
GTmetrix Grade is calculated from two metrics. They are – Performance & Structure
GTmetrix Performance
This score comes from Lighthouse site audit tool.
GTmetrix Structure
It is a proprietary performance metric from GTmetrix that it uses for measuring a webpage’s overall performance.
Web Vitals
Google introduced something called Web Vitals in 2020. Web Vitals is a set of metrics that span over user experience and web performance. Your site needs to excel in both. Though Web Vitals has a lot of metrics, GTmetrix only takes account of three of those – Largest Contentful Paint (LCP), Total Blocking Time (TBT), and Cumulative Layout Shift (CLS).
What are these things? Here is what you need to know:
Largest Contentful Paint
LCP signifies the amount of time it takes for the largest part of your webpage to load. LCP can be anything from a hero image to an intro video, and even just text! How fast this largest part of your webpage will load will depend on what sits at the top of your site.
Total Blocking Time
Total Blocking Time or TBT reflects the total time a webpage is blocked before users can start interacting with it. There are many factors that create the block. CSS and JavaScripts are two of the biggest culprits. You might often hear the term ‘render-blocking.’ It is usually caused by CSS and JavaScripts.
But you need to understand that there are a few JavaScripts that are critical for the proper display of a webpage. If those JS files don’t load first, users will see a broken webpage. Similarly, CSS is designed to be render-blocking. Will you really like to see an un-styled webpage? Here is how an un-styled webpage will look like:
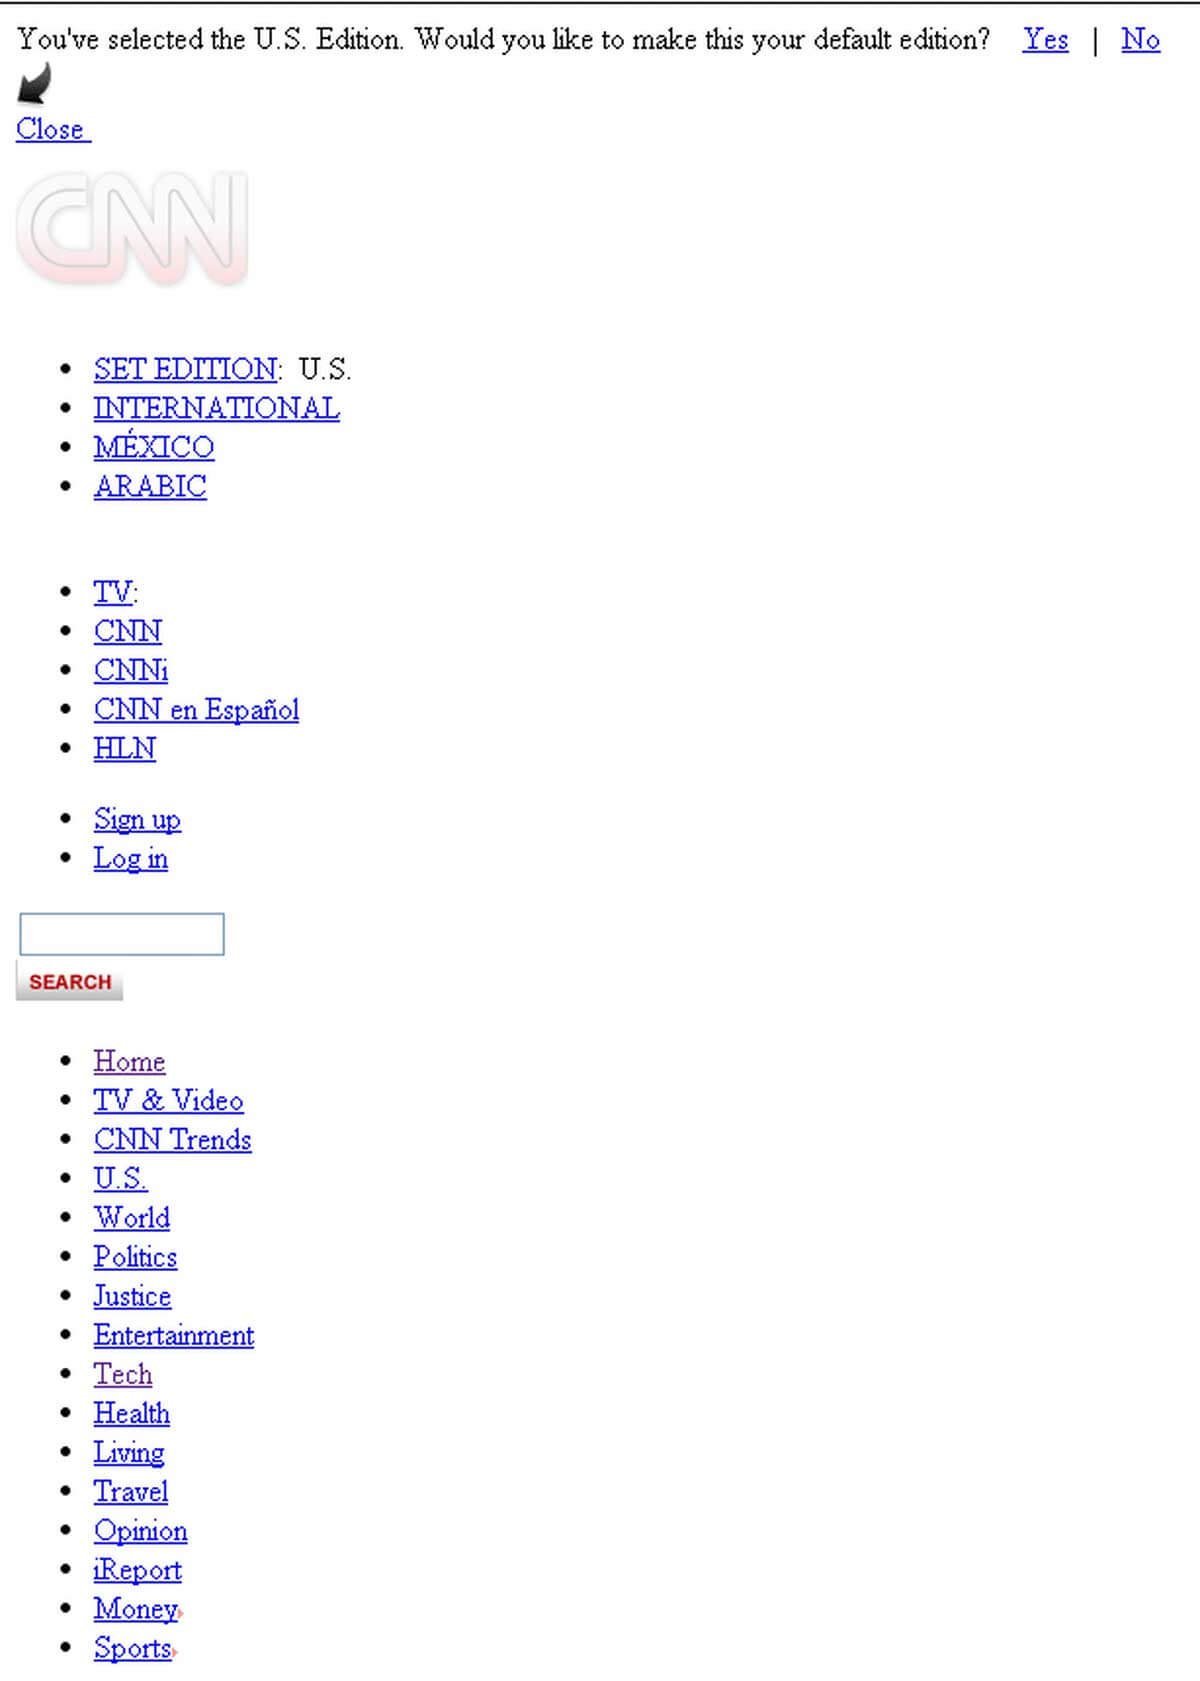
So, it is necessary for certain CSS and JS elements to block the rendering of a webpage to ensure that user experience remains good.
Google will often ask you to:
- Inline CSS and JS.
- Defer loading of CSS and JS.
Some CSS and JS can be moved inline. Some CSS and JS can be deferred. But you cannot do that for all! Depending on the theme and plugins you are using on your WordPress site, you may or may not experience blocking of content rendering. Bottom line is that you may not be able to completely eliminate blocking time. You can reduce it to some extent! The more you can reduce, the better it is.
Cumulative Layout Shift
This wasn’t really a big problem in the past and often many webmasters used the trick into forcing people to click on ads or buy things they didn’t want to. Now, Google has made this an important metric in evaluating the SEO of any website.
If your website has large CLS, you are screwed!
CLS simply refers to massive or even small layout jump when a webpage loads. Here is a nice GIF example of what CLS means:
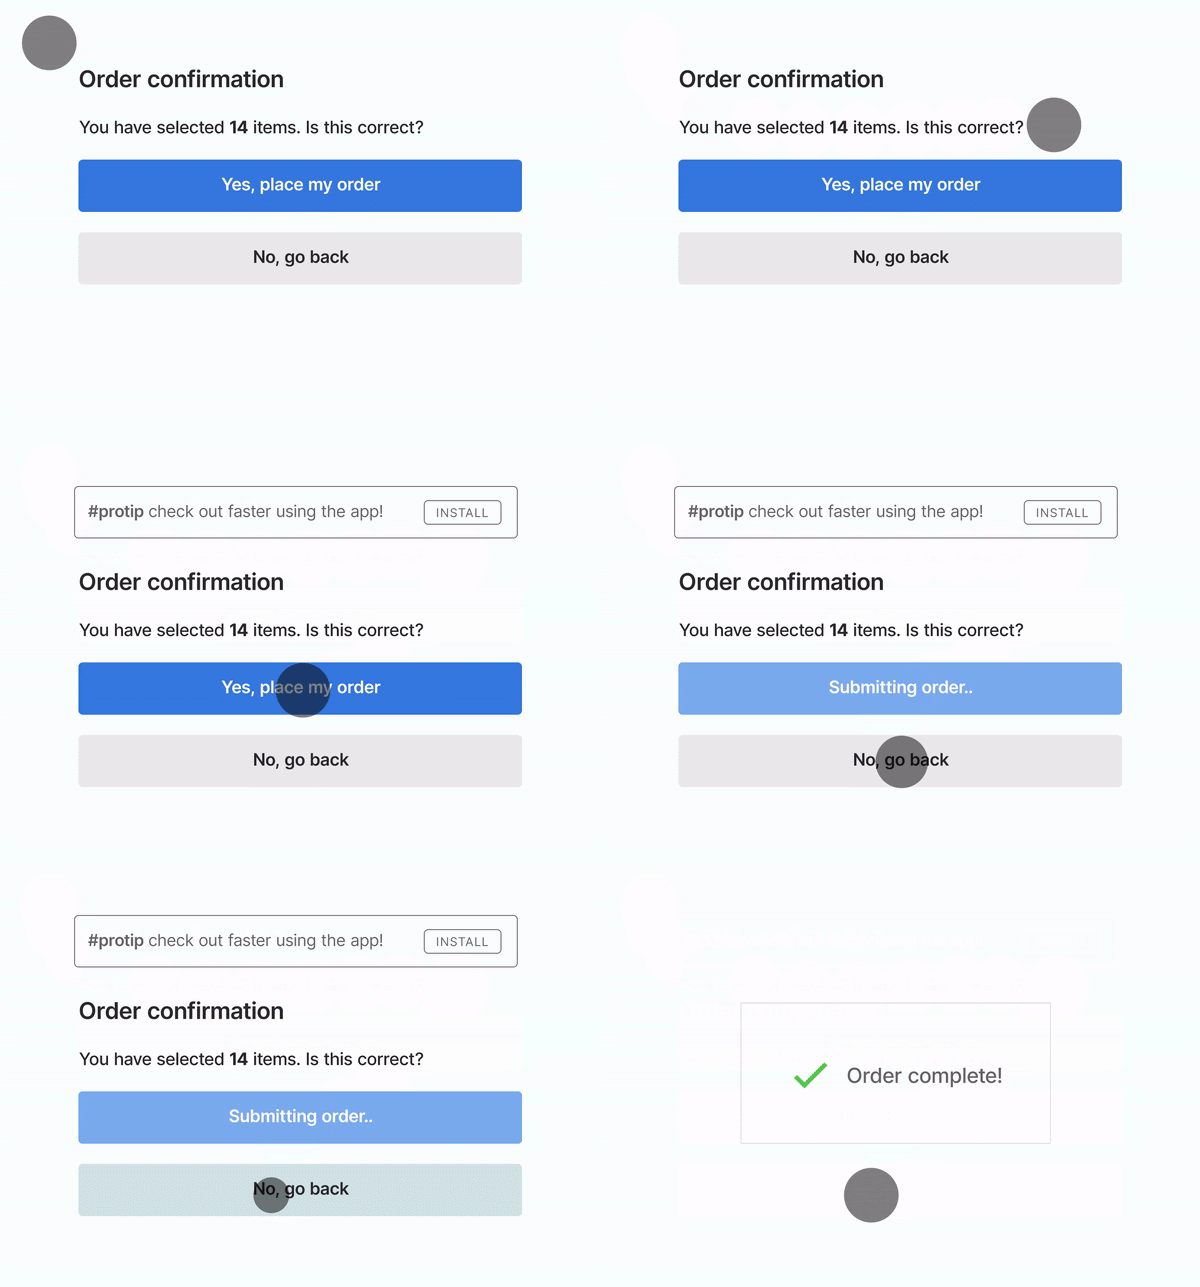
You get the picture, right! It simply means that when a layout shifts suddenly, a user may end up clicking on something that he or she doesn’t want to click on. Such layout shifts can lead to very poor user experience. Google is focusing on eliminating CLS from the web, and hence, those websites that have CLS issue, are being pushed down in the search results.
There are many things that can cause CLS issue. Here are just a few things:
- Embedded Tweets.
- Embedded videos.
- Display ads.
- Lazy loading images where the placeholder is removed until the user scrolls to the area where the image is supposed to be. When the user reaches that segment, the placeholder appears, pushing the content (below the image) down. This is a layout shift.
Don’t forget that CLS issue can be created deliberately!
Your site shouldn’t have any CLS issue. There is an acceptable range, but the complete absence of CLS is desirable.
In the two GTmetrix test screenshots above, you will find the following results:
With Adblock Pro in Use:
- GTmetrix Grade – A
- GTmetrix Performance – 100%
- GTmetrix Structure – 100%
- LCP – 491 ms
- TBT – 7 ms
- CLS – 0
Without Adblock Pro in Use:
- GTmetrix Grade – A
- GTmetrix Performance – 100%
- GTmetrix Structure – 98%
- LCP – 438 ms
- TBT – 3 ms
- CLS – 0
These scores may slightly change except the CLS depending on the test server location, server caching, DNS caching, connection speed, etc.
On an average, if your website is holding on to the performance grade of A, you should be happy. The reason why CLS should remain intact is that it is independent of the test location, connection speed, etc. If there is no CLS issue on your website, it should not magically appear out of somewhere.
The Summary Tab
Below the grading and performance score you will notice a speed visualization that will show the timeline of key events. Take a closer look:

Here is an even closer look:
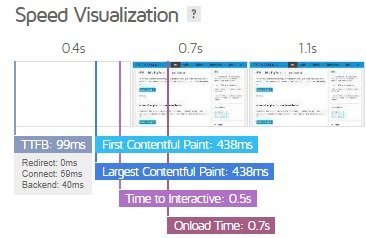
And here is the other part:
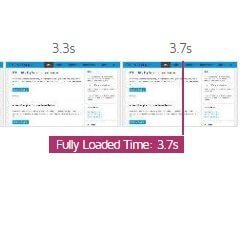
You can find the following things here:
- TTFB
- First Contentful Paint
- Largest Contentful Paint
- Time to Interactive
- Onload Time
- Fully Loaded Time
TTFB: It is the time taken to get or receive the first byte of response from the server after the request was sent by a web browser for a particular webpage. The golden rule here is – ‘the smaller, the better.’ It also signifies how fast your server is responding.
First Contentful Paint: It indicates the time at which the browser paints something, that is, renders something for you to see.
Largest Contentful Paint: It indicates the time taken to paint or render the largest element of the page. It can be a hero image, a video, or text.
Time to Interactive: This is the time when the user is able to interact with the webpage. It can be anything from scrolling to clicking on a link.
Onload Time: This is the time required by the browser to download all the elements of a web page that includes everything from CSS and JS files to images, videos, etc.
Fully Loaded Time: This reflects the maximum time after the FCP and Onload when there is no network activity since the last request was captured. Usually, the Fully Loaded Time is not of big concern.
During the time gap between Onload Time and Fully Loaded Time, the non-essential resources can load. In my case, it was lazy-loading ads, grow.me (social sharing), etc. that took the time. Essentially, the ads on the webpage loaded last, allowing the main webpage (and its contents) to load quickly (within 0.7 seconds).
Okay, now that you have understood what the speed visualization segment has to say, you can see a few more things below it.
Top Issues
This is the segment you see right below the speed visualization. It will give you a quick summary of everything that is wrong with your website, and whether they have high or low impact on your website performance.
This is what you will see:
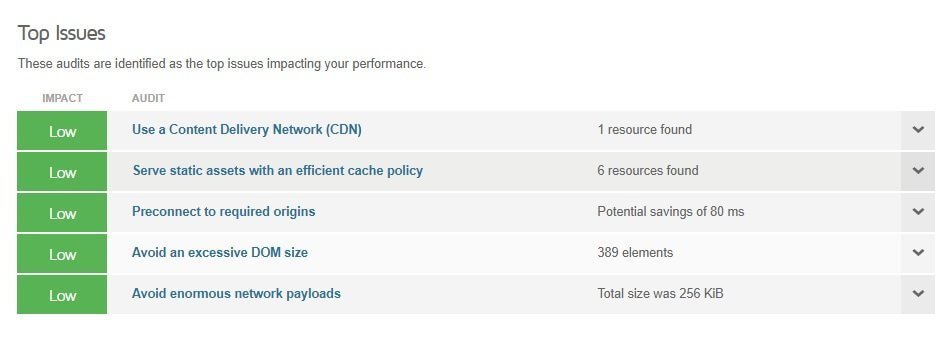
There will be certain elements that you don’t need to worry about as long as the impact is low. For instance, in the example above, it asks me to use a Content Delivery Network (CDN) for one resource. Looking at the resource I found that it was a resource from Mediavine – the ad network that I use.
I cannot put it through a CDN. If I do so, the ads will not work properly! That’s not desired at all, and neither does it have a big impact on the website performance.
Page Details
Underneath the Top Issues is the Page Details segment where you can find a breakup of your page elements and the total number of page requests.
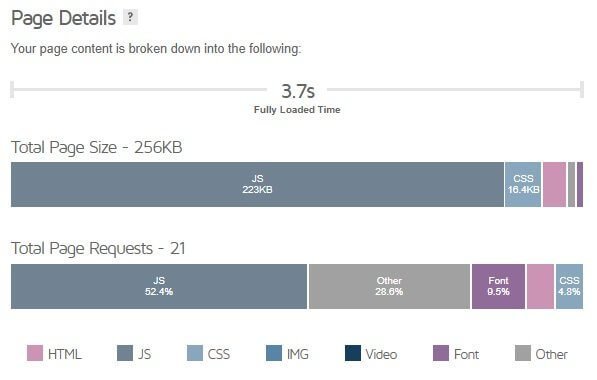
This breakdown will show you the percentage of each element and the total size.
The Performance Tab
Next to the summary tab is the performance tab. Clicking on the tab shows this:
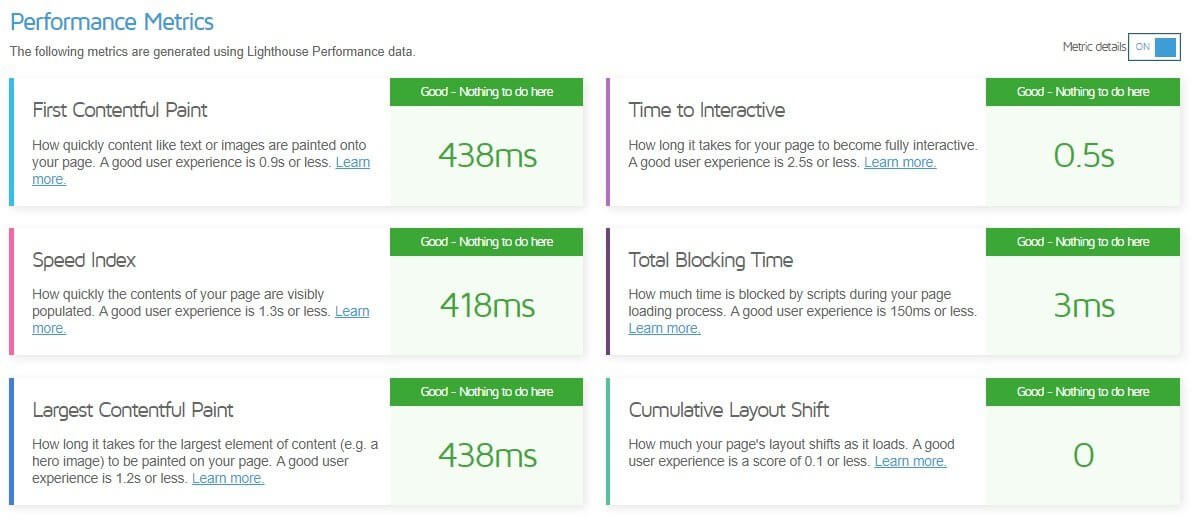
This is where you will see all the elements of Core Web Vitals introduced by Google in 2020. It consists of six parameters:
- First Contentful Paint
- Speed Index
- Largest Contentful Paint
- Time to Interactive
- Total Blocking Time
- Cumulative Layout Shift
This is where you will see how your site performs in all Core Web Vitals metrics. If you turn on the Metric details switch, it will show you the desired value for each metric and the actual value your site has.
Here is a quick list of the desired values:
- First Contentful Paint: 0.9 seconds or less
- Speed Index: 1.3 seconds or less
- Largest Contentful Paint: 1.2 seconds or less
- Time to Interactive: 2.5 seconds or less
- Total Blocking Time: 150 milliseconds or less
- Cumulative Layout Shift: 0.1 or less (this is a score not measured in time)
It is necessary that you perform good in all metrics.
One thing you will notice is that the performance tab is not going to show you what you need to improve or fix. It will only show you the results and the metrics that you should improve on.
If you scroll down further, the page will show you something called Browser Timings. The elements you find here are basically milestones for different key events as reported by the browser. This is what you will see:

You don’t really have to worry much about these. There was a time when you have to optimize all these, but with the emergence of Core Web Vitals, you can focus on those core vitals only. As long as you are performing great in the Core Web Vitals, you should be safe.
The Structure Tab
This tab will show you the more detailed view of the Top Issues segment you find in the summary tab. Here is what you will see:
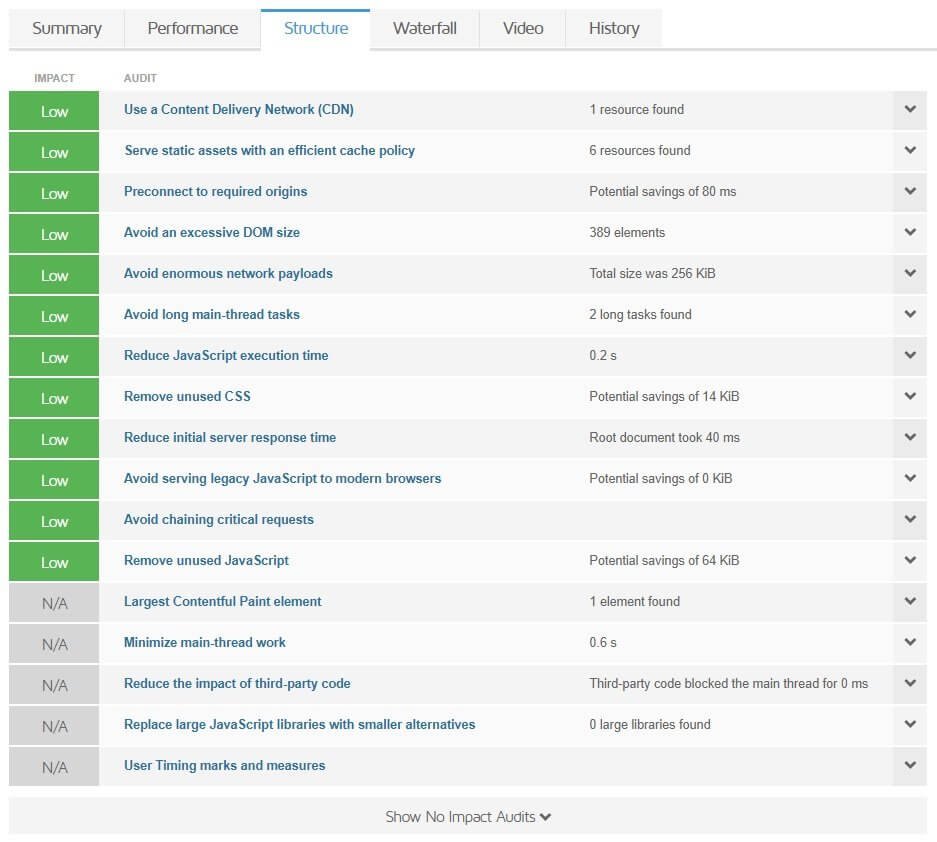
This is where you will see a list of issues, the impact those issues have, and the steps you can take to improve your site.
The first view will not show you the suggestions for improving. However, when you click on the dropdown arrow next to each issue, you will find the exact thing that is causing the problem and a button which will lead you to the suggestion for improvement.
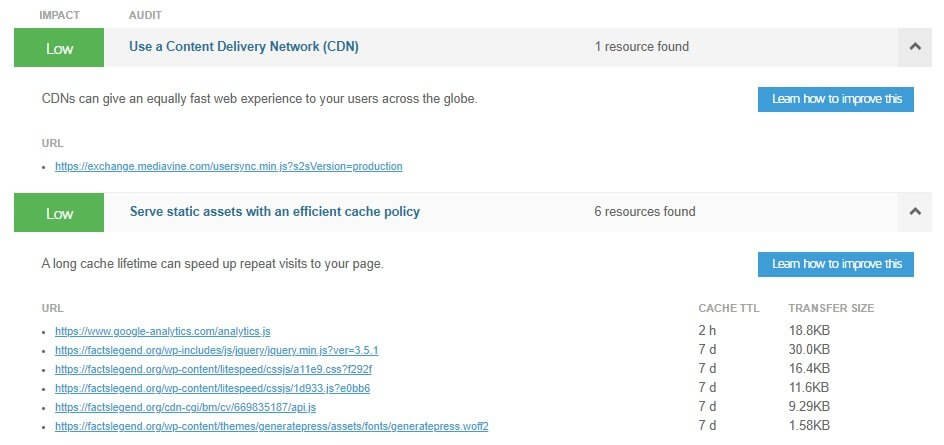
When you click on the ‘Learn how to improve this’ button, it will take you to a new page where you can learn what to do. Essentially, what you will see after you click on that button is a page with a generic description of the problem and the plausible solutions. You cannot get a resolution specific to your needs.
If you don’t know what to do, or if you cannot understand, you and ask some developer to help. Whether you actually need to improve on those things or not will depend on your site needs. For instance, in the screenshot above, GTmetrix is asking me to use CDN for a particular JavaScript that the ad network uses. That’s not a desirable thing.
Again, it uses me to serve static resources with an efficient cache policy. There is a cache policy already set with Cache TTL defined for each of the elements. If I increase the TTL, the recommendations will go. However, I don’t want to cache them for a longer period to ensure proper functioning of my site.
So, whether the recommendations offered by GTmetrix are acceptable or not is dependent on your exact needs. As long as the impact is low, you shouldn’t be much bothered about them.
You will also see a link saying ‘Show No Impact Audits.’ When you click on it, another set of audits show up. Here is what you see:
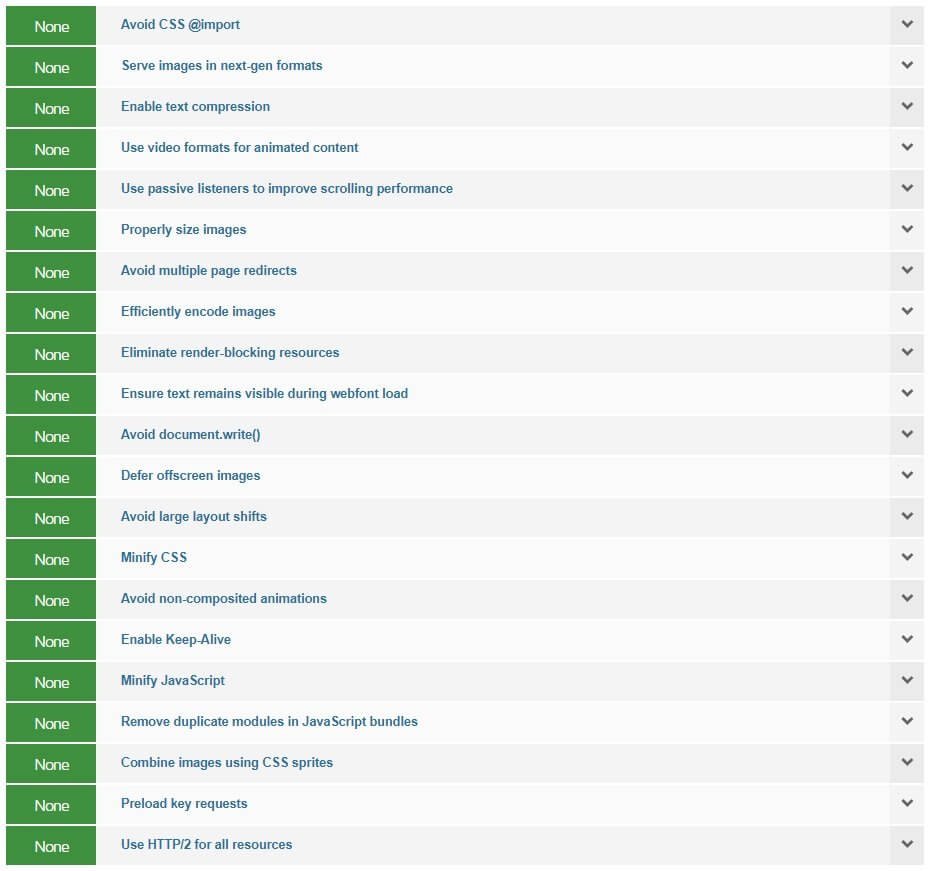
What you see here is basically everything that is right about your website. You need no corrective action for all that are listed here.
The most common errors that people find are:
Use CDN
You should use a CDN. GTmetrix is designed to identify the most popular CDNs by default. Those CDNs include names like Cloudflare, Amazon CloudFront, Netflify, etc. In case you are already using a CDN that is not so popular, you can take corrective steps by reaching out to GTmetrix so that they can include the CDN in their list. Sometimes, certain resources will not load from CDN. Those are not controlled by you, and are usually third-party resources (in my case it was the ad network that is beyond my control). If GTmetrix is flagging those resources, you cannot do anything!
Use efficient cache policy
It simply means that the static resources of your website should be cached for a longer period. However, that entirely depends on what you want. Also, you will see the notice if you haven’t applied any caching at all. You can always use popular WordPress plugins like WP Fastest Cache, WP Rocket, W3 Total Cache, etc. However, I always recommend using LiteSpeed Cache. It works best with LiteSpeed or OpenLiteSpeed server, but you can make it work with Apache or Nginx. In that case, you have to use QUIC.cloud CDN.
Preconnect to required origins
If there are third-party resources that are loading from servers outside your server, you can add dns-prefetch or prefetch hints. However, that requires a lot of technical knowledge. If you don’t know how to do that, you will need a developer.
Alternatively, you can use LiteSpeed Cache that offers you an option of adding the prefetch hint. It is simple!
Avoid and excessive DOM size
If the impact of this warning is high, you need to find a developer who can work on this. This is for advanced users only. So, don’t even think of fiddling around with it. If you do something wrong, you will screw your website for good (or bad)!
Eliminate render-blocking resources
I explained it earlier. You should not always strive to do that. Certain CSS and JS files are critical, and required for proper functioning of the site even if they are render-blocking! You can experiment with deferring CSS and JS files using a caching plugin, but if that’s breaking your site, try to drill down on which particular CSS and JS files are critical for your website. Once you find them, defer every other CSS and JS file except those.
Minify CSS & JS
CSS and JS files often contain unnecessary characters. These characters include things like line breaks, empty spaces, indents, etc. These unnecessary characters add up quickly. You can remove them safely from the source code without impacting the functionality. Once you remove them, it can help to speed up download, parsing, and execution of those files. You don’t have to do anything. Your caching plugin should be very much capable of doing that.
Properly Size Images
Images form an integral part of websites. You need to upload images. However, did you ever think what happens when you upload a large image and someone tries to see that on a mobile device? In the worst-case scenario, the image will not fit in the screen. If possible, the CSS will resize the image to fit nicely into the small screen.
While resizing with CSS may sound cool, it is not really a good method. It increases the load because everytime someone tries to see the image on a smaller screen, a CSS call kicks in. So, the best approach is to make it scale by properly resizing the images. WordPress natively does that. Whenever you upload an image, WordPress will create various scaled versions.
Unfortunately, that may not always be sufficient. So, you might need a separate plugin to do that job for you. You can always rely on LiteSpeed Cache that has image optimization features available. If LiteSpeed Cache is not your thing, you can use services like Optimole or any other image optimization plugin or service.
Serve images in next-gen formats
Next-gen format simply refers to WebP format. This format was introduced by Google only recently, and it is an extremely lightweight format. Unfortunately, WebP format is not supported by all browsers. Google Chrome supports this format. Considering the fact that a large section of internet users uses Google Chrome, you should consider using WebP format.
One easy way of dealing with this problem is to use a third-party service like Cloudflare, Optimole, LiteSpeed Cache (yes, LiteSpeed Cache delivers WebP), etc. All you need to do is upload either a JPG format or a PNG format and the service or plugin will create a WebP version.
Depending on the browser used by an end user of your website, the service or the plugin will deliver WebP version of the images.
Ensure text remains visible during webfont load
Webfonts are delivered from third-party servers. The problem with webfonts is that until they render properly, the text of the website remains invisible. This can lead to bad user experience, especially when the end user is using a very slow connection where font rendering from third-party servers takes a long time.
The possible solutions for this problem are to either ditch webfonts completely or localize the webfonts, that is, download and upload the fonts to your web server and call them directly from your server instead of a third-party server.
While it may sound easy, it is not really that easy for rookies with zero-knowledge of website development. There is an assortment of plugins available that can help you localize webfonts. Also, certain WordPress themes like Soledad has provisions for uploading fonts. You can download the webfonts and use the theme’s built-in options to upload the fonts to your server in the desired destination.
Loading fonts locally can resolve this issue. However, I will still suggest that you ditch webfonts completely!
Use HTTP/2 for all resources
This is beyond your capabilities. HTTP/2 support has to be provided by the web server software. Apache added support for HTTP/2 in 2015, but web hosting companies using the older Apache version may have to install extra modules.
Nginx supports HTTP/2 by default, and so does LiteSpeed and/or OpenLiteSpeed. If you are seeing this as a warning or a suggestion, you must ask your web hosting company to integrate the support on Apache web server. If they are reluctant to do that, the only way of getting around this is to change your hosting company.
Reduce initial server response time
How fast your server responds is dependent on many factors. One of them is whether the server has SSD storage or not. Well, even if the server does have SSD storage, it might not make a big difference if you are not using caching.
The problem with WordPress is that it uses PHP for dynamically build pages for every request. So, if there are multiple requests at the same time, it can quickly get overwhelming.
This is where caching comes in. With caching you can pre-generate HTML files. Whenever requests come it, instead of using PHP for processing those requests, the server can send the pre-generated HTML files. This will improve the server response time. In Google PageSpeed Insights or even in GTmetrix, you will see something like ‘the initial rookit document took 70ms.’ It should ideally be less than 50 milliseconds or less.
If it is more than 50 milliseconds you will very likely see the warning. So, the best way to deal with this problem is to use a good caching plugin like WP Rocket or LiteSpeed Cache.
The Waterfall Tab
This is the tab where you can see individual requests on a webpage. You can analyze every request from here and find out what is causing the issue of slow loading. This is what the waterfall looks like:

This might be intimidating, and surely it is for any rookie.
If you hover your mouse pointer on the colored bars you can see a lot more information. You can see meanings for each color codes. Here is what you will see:
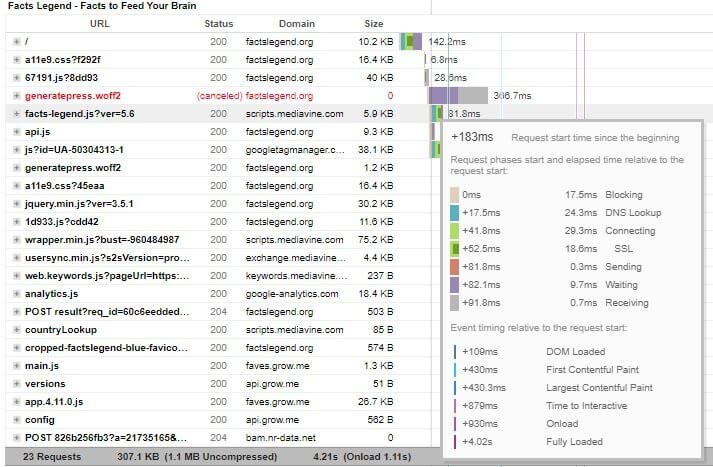
What do these color codes mean? Let’s check out in details…
Blocking [Brown Color]
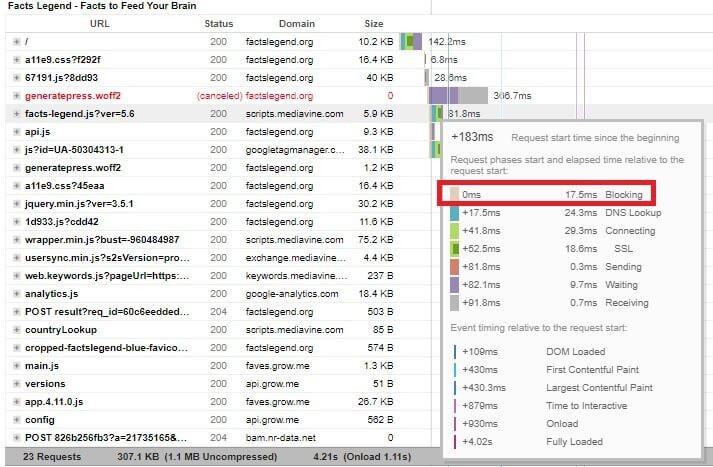
I mentioned earlier that when a webpage loads, it downloads CSS and JS files. These are the files that prevent a webpage from displaying the information until they downloaded and processed. Deferring them is often the solution, but some CSS and JS files are critical, and they are required for the webpage to function properly. That’s the reason why, deferring every CSS and JS file not an ideal solution. This blocking time may remain.
If you are using any page builder, you can expect to see a massive bump in this blocking time, because page builders often use bloated CSS to deliver the design you create. So, my advice is to shun page builders no matter how popular they are.
DNS Lookup [Teal Color]
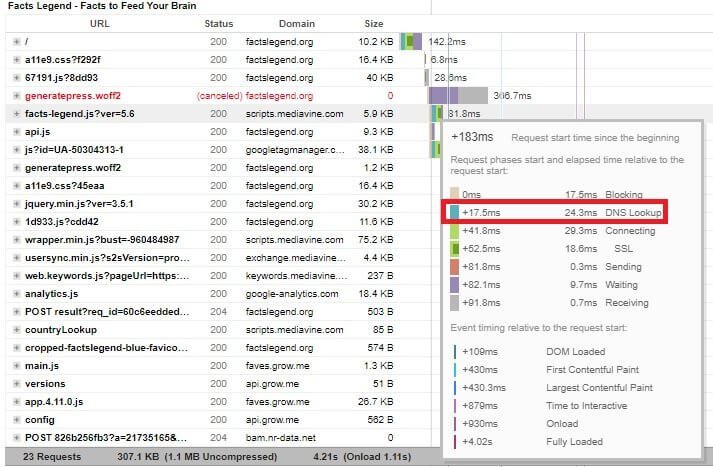
There are specific servers that go by the name Domain Name Servers. They hold vital information about your website and the IP to which it should be routed to. When you perform a website test with GTmetrix for the first time, it queries the DNS records to get the IP. This takes up some time.
However, GTmetrix stores that information. The second time you run your website through GTmetrix, the lookup time reduces and your website speed may go up by a few milliseconds. You need to understand that DNS lookup time should not be considered seriously. You should take the average time after running multiple tests unless you really want to include DNS lookup time in your speed test report. If that is the case, you should take time taken during the first test.
The same thing happens with cached files. If you are using a CDN then the cached files will be served during the repeat tests. This will improve the page load time. So, if your first test doesn’t show significantly good results, run the test multiple times. The CDN serving cached files should improve speed.
Now, the thing is that there may be elements on your site that are being served from third-party servers. DNS lookup for those servers also eat up time. So, it is better that you try to prefetch them. Prefetch will allow the browser to look for them in the background while it retrieves your website content.
If you are using latest version of WordPress or any version starting from 4.6, you can use resource hints to prefetch. It is a technical thing and requires a developer’s interference. Typically, resource hints code looks like this:
function makewp_example_resource_hints( $hints, $relation_type ) {
if ( ‘dns-prefetch’ === $relation_type ) {
$hints[] = ‘//make.wordpress.org’;
} else if ( ‘prerender’ === $relation_type ) {
$hints[] = ‘https://make.wordpress.org/great-again’;
}
return $hints;
}
add_filter( ‘wp_resource_hints’, ‘makewp_example_resource_hints’, 10, 2 );
If you are unable to do this, you can use a caching plugin that allows prefetching DNS. The caching plugin that I know is capable of doing this is LiteSpeed Cache. I don’t really know about other plugins. So, if you find that option in other plugins, you can use that. All you need to do is add the URLs of the external resource in LiteSpeed Cache, and it will do the rest.
Connecting [Green Color]
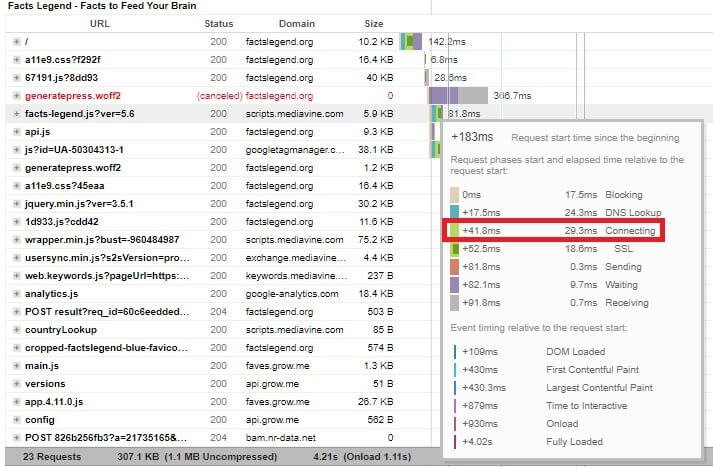
This shows the time taken by a browser (client) to connect with the server. A TCP connection is made between the server and the browser. You don’t really need to understand a damn thing about this.
SSL [Two Green Colors]
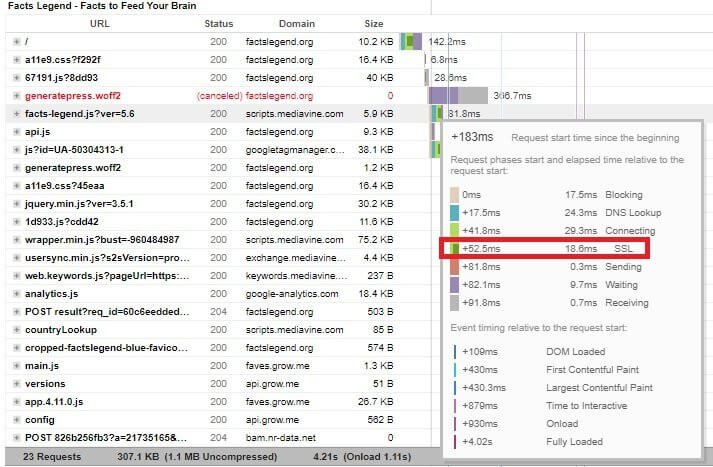
This represents the time taken to verify that the connection is secure and that the connection has happened between the browser and the intended server (and that there is not imposter middle man in between). Again, you don’t need to worry about this.
Sending [Red]
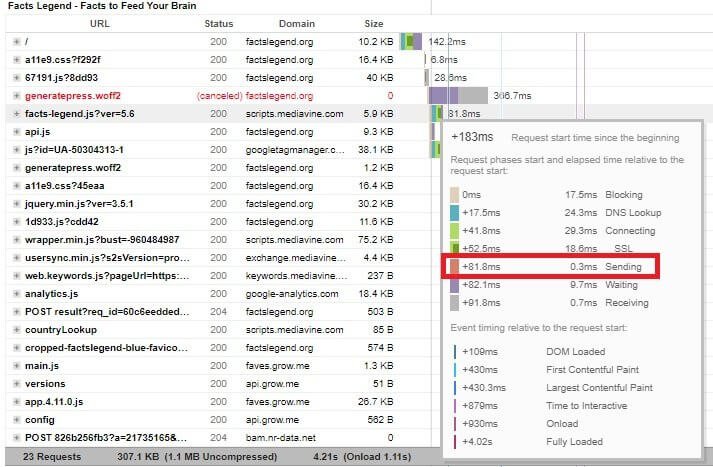
It simply means the time browser takes to send data to the server. That’s it!
Waiting [Purple]
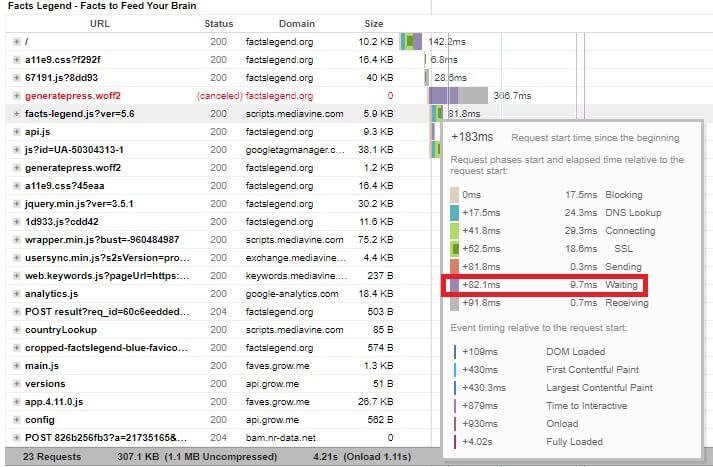
This is the time to first byte (TTFB). It indicates how responsive the wen server is. Typically it should be below 100 ms. The lesser the better. If this time is somewhere between 300 ms to 400 ms, you should ask your hosting provider why the sever responds slowly. If you are on a shared hosting server, most likely the hosting provider will shrug off the responsibility and put the blame on you.
Usually, servers with SSD storage and proper configuration should respond within 100 ms. In the screenshot above, it is 82.1 ms approximately, which is great!
Yes, you can reduce TTFB from your end by implementing a proper caching mechanism and using a CDN. So, make sure that you are opting for a reputed CDN like Cloudflare.
Receiving [Grey Color]
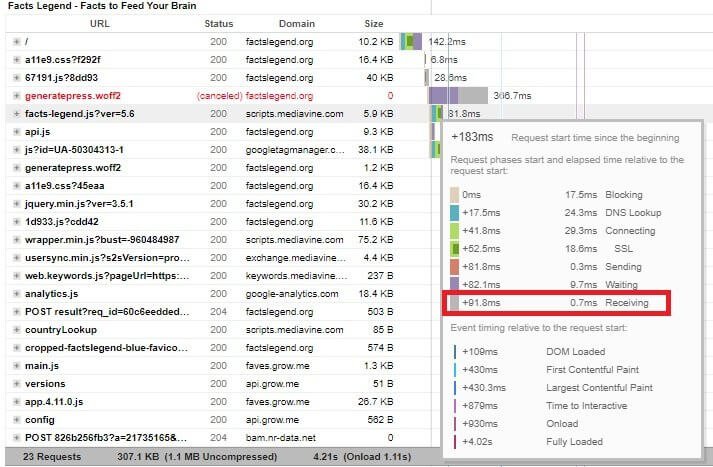
This simply indicates the time it takes for the browser to receive data from the server. That’s it!
You will also notice something called Event timing relative to the request start. It simply represents the time taken for each major event after that particular request.
HTTP Response Header
You can click on any individual request and you will see additional details. This is what is known as HTTP Response Header.
You can get some interesting information from here. For instance, you can know whether caching is caching available or not. You will see something called HIT or MISS. HIT means there is caching and MISS means caching is not available. You can also know whether Gzip compression is available or not. You can even know the server. Of course, if your site is sitting behind Cloudflare, the server will be shown as Cloudflare.
You can even see the response version (HTTP/2 or HTTP). Here is how it looks like:
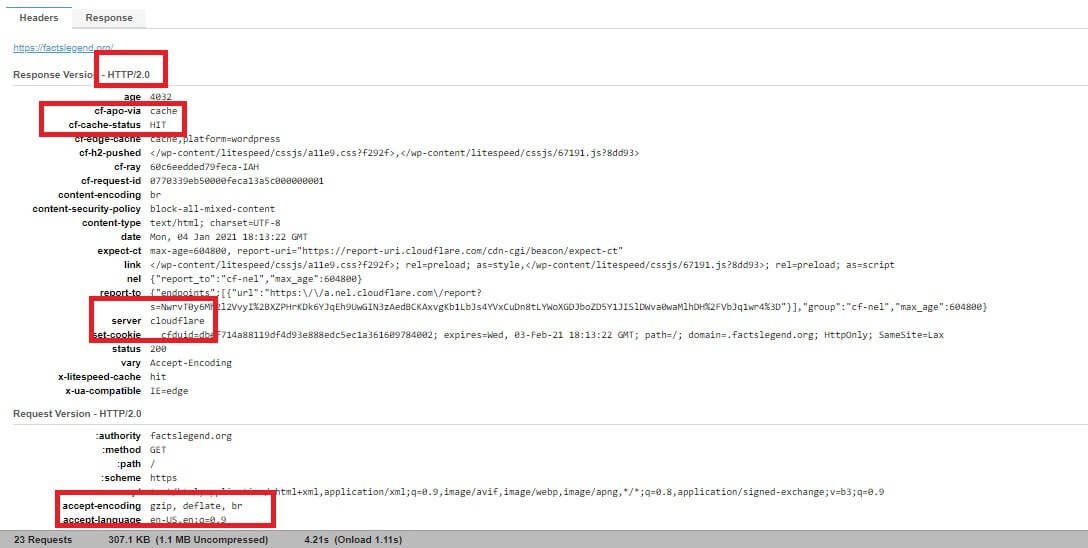
Remember that Pingdom doesn’t support HTTP/2. That’s another reason why I don’t like Pingdom. So, you better stick with GTmetrix or some other tool like Google PageSpeed Insights.
The Video Tab
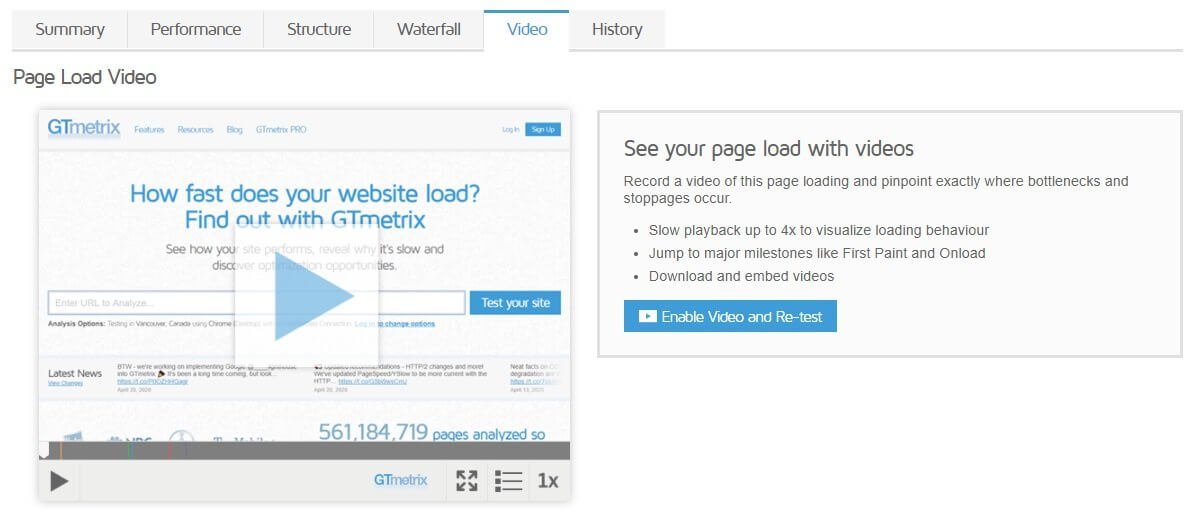
The video tab is where you can see a recorded video of how your webpage loads. This is particularly helpful if your website is experiencing visual issues only on certain browsers and screen sizes.
You can use the video to debug visual issues. Again, it is a more suitable thing for developers who can quickly tell what is causing such visual issues just by looking at the page load. For untrained eyes, that’s nearly impossible to figure out the root cause simply by looking at the visual issue.
The video is embeddable, and you can slow down the video by 4X to clearly see the loading behavior. The video feature is not enabled by default. You need to enable video recording and then run the test.
The History Tab
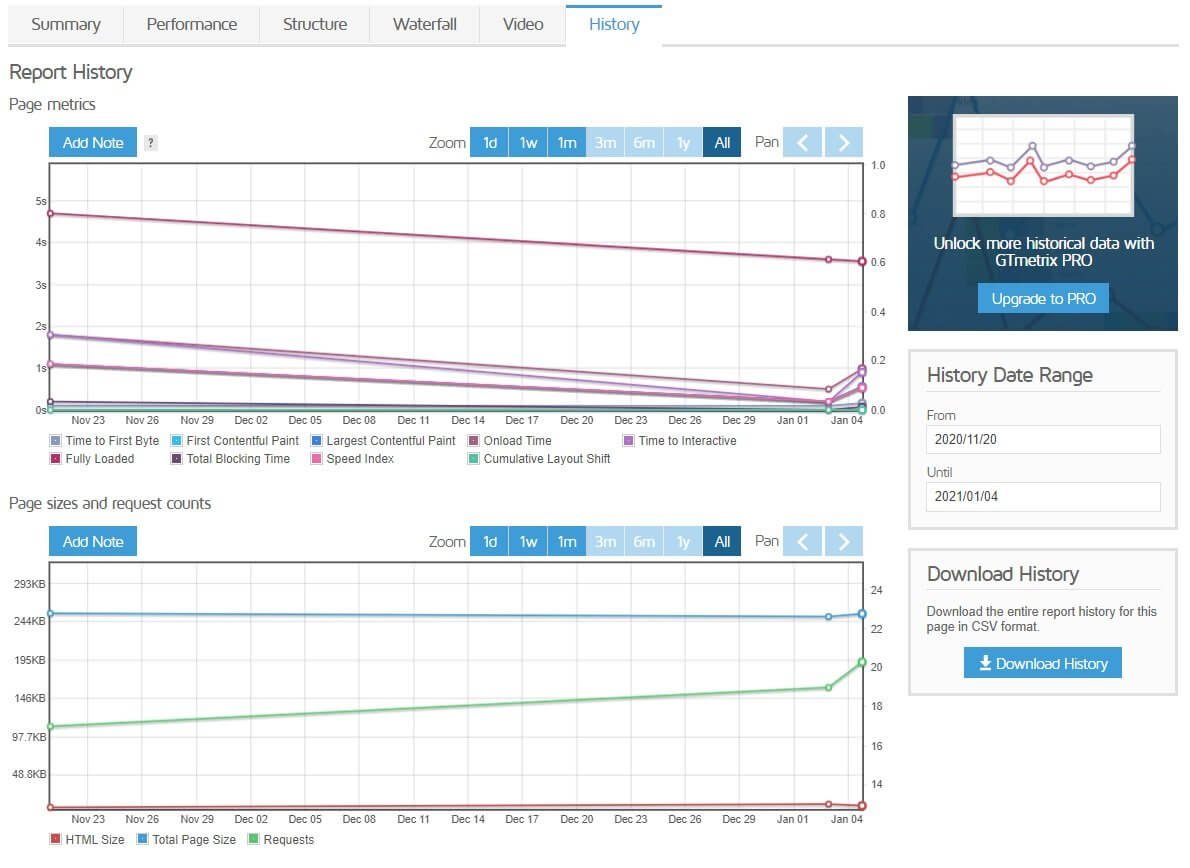
This tab will give you graphical representation of the results of past tests. The number of tests that the free account can store is limited. If you need a longer historical profile, you need to upgrade to their premium version.
You can define the date range to see the historical data, and you can you can even download a CSV copy of the same. Going through the history can help you understand how your website improved or deteriorated over the time. If you see a decline in performance over time, you can pin down the changes you made that eventually caused such downfall.
Conclusion
Overall, GTmetrix is a powerful tool. When used properly, you can fix a lot of issues with your website and help it score a high rank in Google search results. Yes, there are many things you will not understand, and there are many more that you cannot implement by yourself even if you understand the essence.
Whether you can do it by yourself or whether you need to hire a developer to fix the errors of your website, GTmetrix can play a very vital role in fixing many errors that can have huge impact on your website load timing.
No, GTmetrix will not restrict you to testing only the homepage. You can test any inner page as well. There’s no limit to the number of tests you can perform using the free version. There is no need to settle for the premium version. The free version is powerful enough to iron out more than 90% of your website issues.
So yes, I will recommend that you use GTmetrix to get actionable insights on your website.
